This case study offers a rare deep dive. We are pulling back the curtain on the raw data: spend, ROAS, CPC, and the critical levers we pulled. Our client has graciously agreed to let us share these results, provided we keep the brand name and exact niche confidential for competitive reasons.
We took the reins of this account in late 2024 and managed it through late 2025. The brand sits within the "Premium Home Organisation & Storage" niche.
Shopify
Approximately 40 high-intent products.
We launched with Standard Shopping and a meticulously curated product feed. We purposefully excluded low-margin accessories, such as chargers, that often trigger "junk" clicks and lead to significant budget bleed.
We ran Standard Shopping for five weeks to harvest enough behavioural data to eventually feed the PMax algorithm.
In the early days, we tracked both "Add to Cart" and "Purchases" as primary conversions. This strategic move gathered conversion signals faster to help us understand exactly where users might be dropping off. After three weeks, once the pixel was "seasoned," we moved "Add to Cart" to a secondary conversion and focused exclusively on "Purchases" as the primary goal.
The initial numbers were promising: a 3% conversion rate and a 350% ROAS.
We started in March 2020 with 5 to 25 visitors per day (216 total for the month) and 314 sessions coming from organic search. These numbers grew to 1,401 users and 1,684 sessions in March 2021, representing a 548% and 426% increase respectively. After four weeks of running dual PMax campaigns, the contrast in performance was clear.
After four weeks of running these dual PMax campaigns, the contrast in performance was jarring.
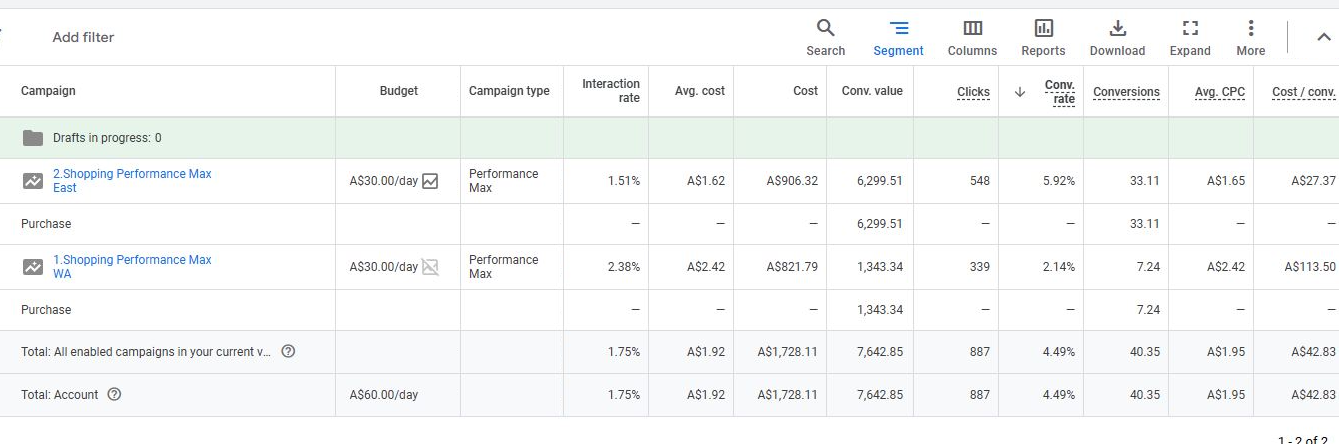
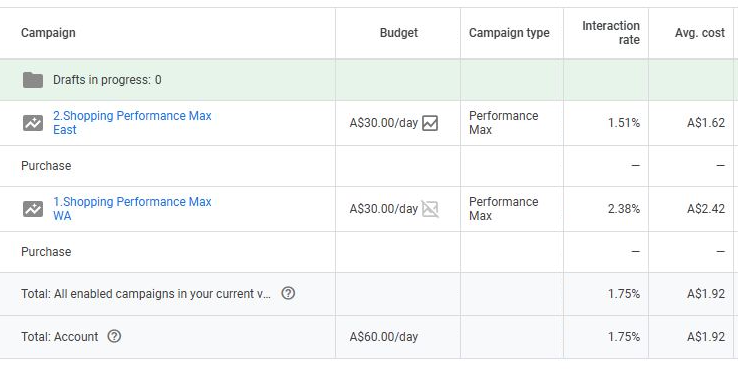
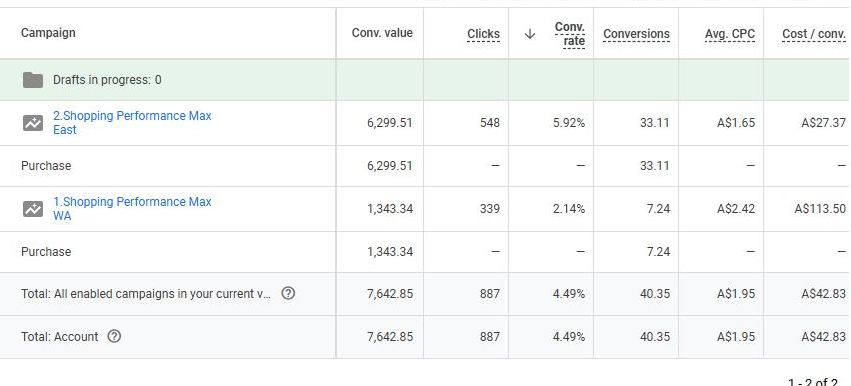
A massive 5.92% conversion rate, 695% ROAS, and $6,299.51 in conversion value.
A lackluster 2.14% conversion rate, only $1,343.34 in conversion value, and a disappointing 163% ROAS.
We did not simply wait for the algorithm to "learn." Our team took an aggressive approach by overhauling the WA campaign's product titles, refreshing the imagery, and upgrading the video assets. Most importantly, we tightened the audience signals to ensure we were not wasting budget on uninterested users.
The results one month later were nothing short of a transformation:
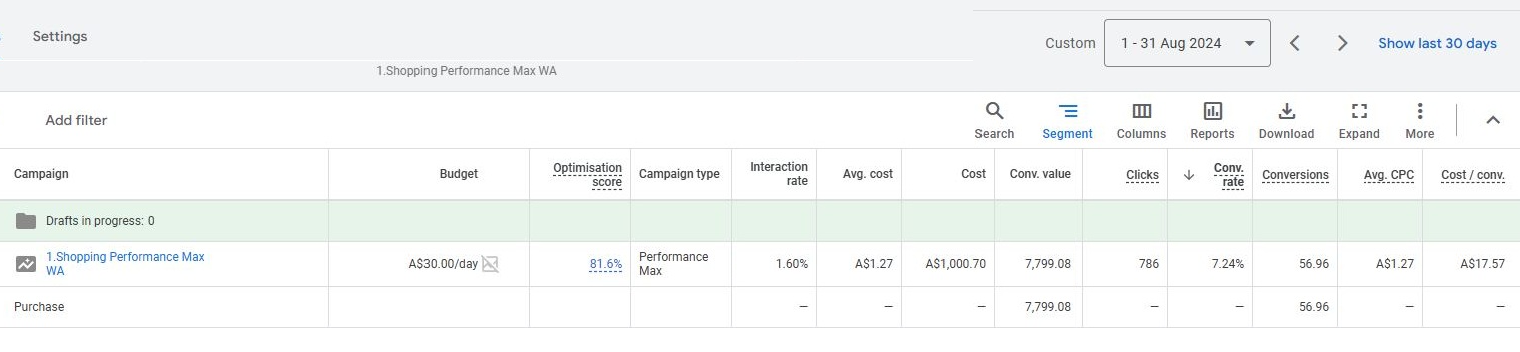
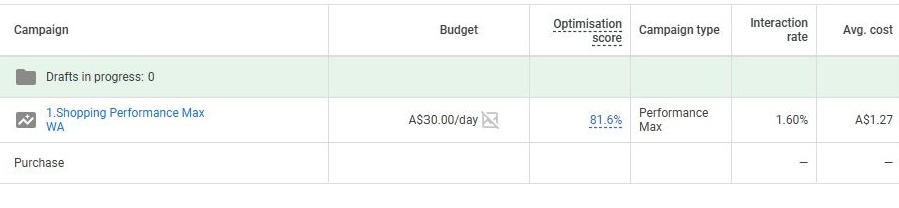
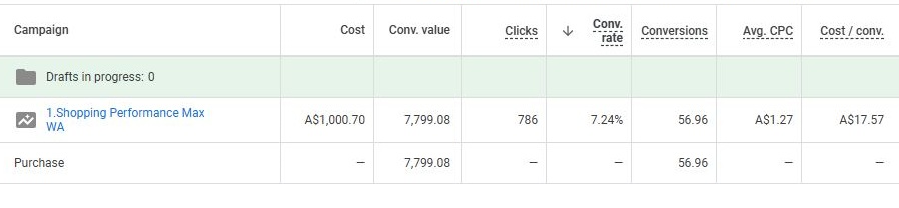
The WA campaign skyrocketed to a 7.79 ROAS with a 7.24% conversion rate. This was one of the highest conversion rates we have ever recorded for a Shopping campaign.
The bar was incredibly high, but we wanted to see if we could find even more efficiency. We continued to refine and monitor the account daily. By the following month, the data was exceptional.
By the following month, the data was almost unbelievable:
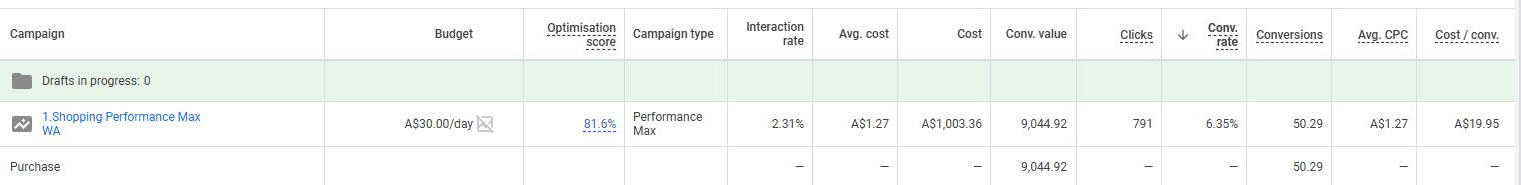
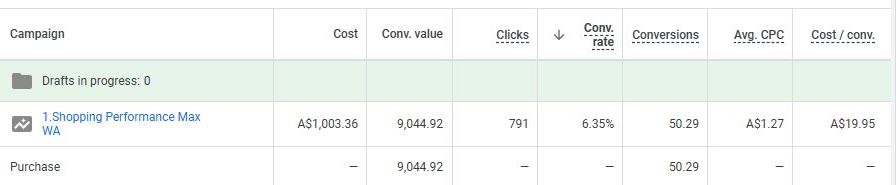
While the conversion rate normalised slightly to 6.35%, the financial efficiency hit a new peak. We generated $9,044.92 in conversion value on that single campaign with a staggering 901% ROAS. This result proved even "underperforming" regions can become gold mines with the right creative and structural intervention.
 0413 107 893